Installing Trycarbonara on Kubernetes Cluster
Welcome! This guide will walk you through installing Trycarbonara into your cluster. Currently, Trycarbonara supports Kubernetes as the initial VM offering for some hyperscalers (aws, azure & gcp). Trycarbonara leverages kube-prometheus-stack helm chart that includes all dependencies to get up and running and takes only a few minutes to install.
Trycarbonara currently only supports AWS, GCP and Azure in US Regions. Support for EU coming soon! If you are running on-prem or colocation, we can accomodate your requests, please contact hello@trycarbona.com
Note: Trycarbonara’s Methodology is loosely based on Methodology | Cloud Carbon Footprint
Before you begin
In order to deploy the Trycarbonara helm chart, ensure the following is completed:
Step 1: Install Trycarbonara Client
Trycarbonara client requires Python (version 3.7+) to run. We recommend using a virtual python environment for using the tool for the best performance. The client is available on PyPi.
❯ pip install cbrctl
Step 2: Install Trycarbonara Agent
Configures your cluster with Trycarbonara agent. Running the following commands will also install Prometheus, Grafana, and kube-state-metrics in the namespace supplied. View install configuration options here.
# Initialize Trycarbonara context
❯ cbrctl init --provider aws
Context Initialized.

# Trycarbonara Context is persisted at "~/.kube/carbonara_config" locally
# Generate Trycarbonara auth token
❯ cbrctl auth
Please enter a valid name: <USER_NAME>
Please enter a valid email: <USER_EMAIL>

Please persist your auth token: <GENERATED_256_BIT_TOKEN>
Context Updated.

# Trycarbonara Token is also persisted at "~/.kube/carbonara_config" locally
# Configure target cluster with Trycarbonara packages
❯ cbrctl config
Enter target cluster: <CLUSTER_NAME>

Cluster Configured Successfully. Happy Carbonara \m/

# By default, the token is fetched from the Trycarbonara config file. Otherwise it can also be passed using the `--token` flag.
# Current cluster name is picked up from kubectl current context.
Note: Currently Trycarbonara tooling supports monitoring all user’s cluster with an exception of
carbonara-monitoringand some system levelkube-*.namespaces. We will soon be supporting dynamic lisitng of these namespaces to monitor.
# Validate status and make sure all pods are running
❯ cbrctl status
In case, any pod is not running, please refer to these Troubleshooting steps.
Step 3: Launch Visualization
The client exposes Grafana to external IP using Load-Balancer. The launcher will use the default browser to open the dashboard link. Secured Grafana uses username as admin and password as prom-operator.
# Expose Grafana dashboard and launch it
❯ cbrctl show
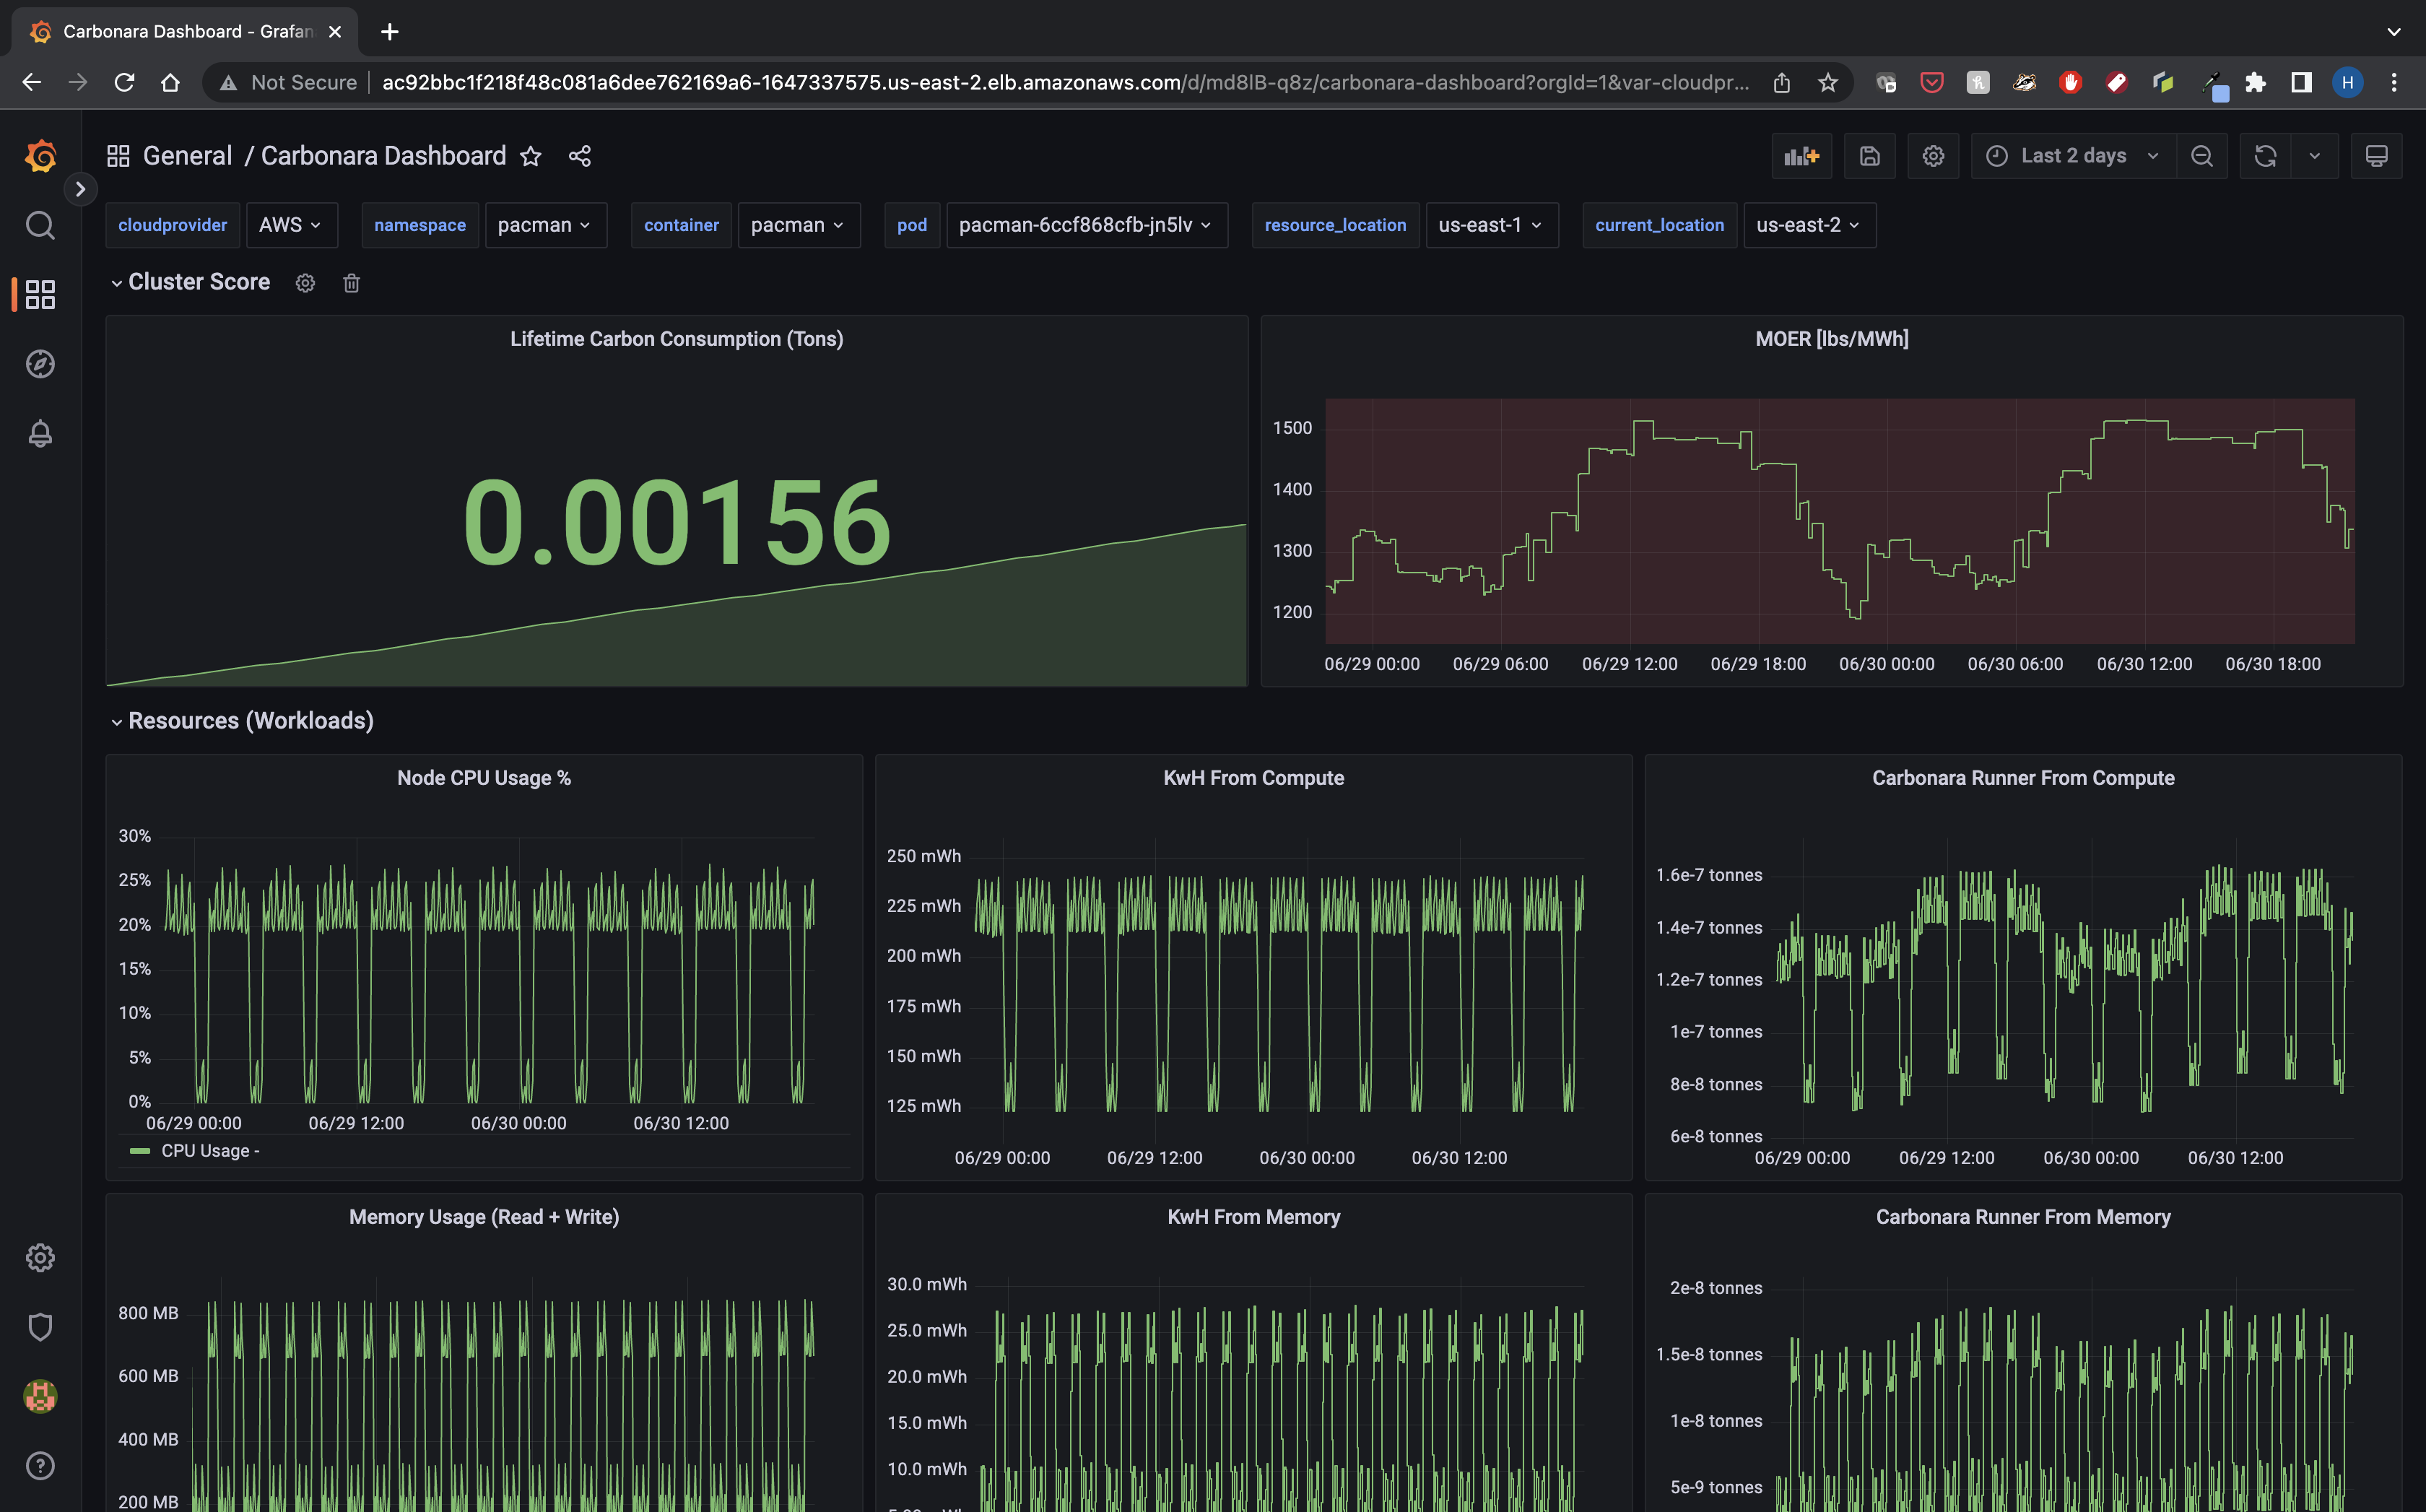
Sample Dashboard:

Step 4: Trycarbonara Insight
Explore the dashboard for viewing your Carbon Emission score for all your running workloads.
Updating Trycarbonara Client
# Installs new version from pypi
❯ pip upgrade cbrctl
Updating Trycarbonara Agent
# Coming soon ...
Uninstalling Trycarbonara
# Uninstalls resources configured by Trycarbonara
❯ cbrctl eject
# Uninstalls Trycarbonara Client
❯ pip uninstall -y cbrctl